An article was recently published by YaleEnvironment360, titled As Climate Warms, a Rearrangement of World’s Plant Life Looms (June 17, 2021). The article starts with two summary sentences: “Previous periods of rapid warming millions of years ago drastically altered plants and forests on Earth. Now, scientists see the beginnings of a more sudden, disruptive rearrangement of the world’s flora – a trend that will intensify if greenhouse gas emissions are not reined in.” How did an international team of scientists arrive at this dire conclusion? They utilized more than 1,000 fossil pollen records collected from across the globe to compare rates of floral change over the last 18,000 years. A community of scientists, ranging from paleoecologists to climate scientists, are dedicating thousands of hours to understand floral changes going as far back as the Pleistocene Epoch of geologic time.
Pollen grains provide valuable data to aid scientists in reconstructing records of Earth’s climate history. Although the grains may only be between 10 and 200 micrometers in size (note there are 1,000 micrometers in 1 millimeter!), the walls of pollen grains are very strong and chemically stable, which allows them to remain preserved over time in sediment layers in locations such as the bottom of ponds, lakes, and even our oceans. Pollen records can help determine how an ecosystem responded to changes in past climate, what current changes are taking place, and determine possible changes in vegetation and ecosystems in the future. Note that we have fossilized pollen records that date back to 240 million years ago (ScienceDaily, 2013)!
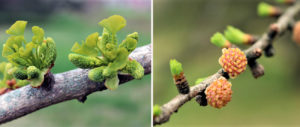
Maidenhair Tree, Ginkgo biloba Pollen Cones and Tamarack, Larix laricina Pollen Cones
So how do scientists access and study historic and fossilized pollen? The process involves heading out into the field to collect sediment core samples – a challenging and time-consuming process that requires a variety of field gear and equipment. At the field site, the cores are measured, photographed, and visual observations are jotted down. The cores are then wrapped to prevent any contamination while being transported back to the United States Geological Survey (USGS) Florence Bascom Geoscience Center’s Palynology Laboratory, or one of any other palynology laboratories at institutions from the University of Washington to the University of Florida.
In the laboratory, the cores are cataloged, cleaned, and photographed. Then, the sampling begins. Sections of the core are cut into ~1-centimeter intervals at a recorded depth, weighed and dried, then subsampled for pollen processing. The core samples are treated with chemicals, heat, and ultrasonic treatments to break apart the pollen and to remove the genetic material in each pollen grain. This material is then stained and placed on microscope slides for identification and counting. From what scientists see through a compound microscope, they generate diagrams of the types and abundance of pollen in the sample. From there, scientists can extrapolate which plant species, and plant communities, were present at the time. Since ancient plant species required specific temperature ranges and moisture levels – just like modern-day plant species – a view of what species lived where gives the scientific community valuable data on what the climate might have looked like. These data allow for the reconstruction of local and regional paleoclimate records, which can then be used to help determine how the overall climate has changed over time, and how human activities have impacted ecosystems, and from that perhaps what can be done to protect natural resources.

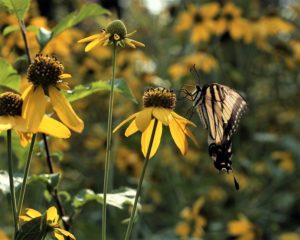
For a deeper dive into the field of palynology, check out With Palynology We Can See the Tiniest Details. And if you wish to explore paleoclimate data derived from pollen records and other sources, visit NOAA’s National Centers for Environmental Information Paleoclimatology Data website. But the changes in pollen and plant distribution over time is just one part of a larger story. Another article published by YaleEnvironment360 alerts us that the increasing levels of carbon dioxide in our atmosphere are altering plant physiology and significantly reducing protein in important sources of pollen – which then may contribute to bee die-offs. So it is not just changes in pollen distribution we’re seeing because of climate change, but changes that impact our pollinators as well.
The data we gather from pollen cores can provide valuable clues as to how climate has changed over time – and the way the ecosystem changed around it. We expect we will continue to see disruptions as a result of climate change. We can form science-based projections about what the coming years will look like, but right now the true scope of the impact on plants, pollen, and pollinators is not a positive one unless we take steps now to curb the current warming trend. But just as scientists are doing the work of analyzing pollen cores for clues about paleoecosystems, Citizen Scientists are working in our communities right now to report vital data about the changes we’re currently seeing. Projects like Firefly Watch, Monarch Watch, and The Great Sunflower Project, which Tyler will be participating in this summer in the newly enhanced Butterfly Garden habitat, all help scientists to get an accurate picture of how the climate is changing right now and how that is affecting the species that we live alongside. All it takes is thoughtful and engaged citizens dedicated to a more sustainable future.